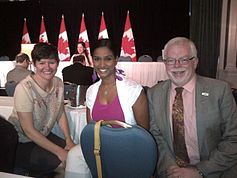

Mike Sullivan (Canadian politician)
Quick Facts
Biography
Michael D. "Mike" Sullivan (born November 9, 1952) is a former Canadian politician. He was a New Democratic member of the Canadian House of Commons from 2011 to 2015 who was elected to represent the Toronto riding of York South—Weston.
Background
Sullivan was born in Detroit, Michigan but grew up in Windsor, Ontario. Sullivan graduated from the University of Toronto with a Bachelor of Science degree in 1973. From February 1974 to November 1984, Sullivan worked for Canadian Broadcasting Corporation (CBC) where he was radio master control operator. From 1984 until his election to the House of Commons in 2011, Sullivan was a national representative for the National Association of Broadcast Employees and Technicians (NABET) and later the Communications Energy and Paperworkers (CEP) where he worked with CBC, Sun Media and Torstar newspapers.

Politics
Sullivan ran as the NDP’s candidate 2008 federal election. He was defeated by Liberal incumbent Alan Tonks by 6,430 votes. In 2011 he tried again, this time defeating Tonks by 2,580 votes.
He served as the NDP’s Deputy Critic for Housing and Disability Issues. In the 2015 election, Sullivan was defeated by Liberal candidate Ahmed Hussen by 7,622 votes.
Electoral record
| Canadian federal election, 2015: York South—Weston | ||||||||
|---|---|---|---|---|---|---|---|---|
| Party | Candidate | Votes | % | ∆% | Expenditures | |||
| Liberal | Ahmed Hussen | 20,093 | 46.0 | +13.2 | – | |||
| New Democratic | Mike Sullivan | 13,281 | 30.4 | -9.7 | – | |||
| Conservative | James Robinson | 8,399 | 19.2 | -5.1 | – | |||
| Libertarian | Stephen Lepone | 1,041 | 2.4 | – | – | |||
| Green | John Johnson | 892 | 2.0 | -0.8 | – | |||
| Total valid votes/Expense limit | 43,706 | 100.0 | $203,157.28 | |||||
| Total rejected ballots | 362 | 0.82 | +0.02 | |||||
| Turnout | 44,068 | 62.63 | +9.53 | |||||
| Eligible voters | 70,361 | |||||||
| Liberal gain from New Democratic | Swing | +11.45 | ||||||
| Source: Elections Canada | ||||||||
| Canadian federal election, 2011 | ||||||||
|---|---|---|---|---|---|---|---|---|
| Party | Candidate | Votes | % | ∆% | Expenditures | |||
| New Democratic | Mike Sullivan | 14,122 | 40.1 | +12.1 | – | |||
| Liberal | Alan Tonks | 11,542 | 32.8 | -13.8 | – | |||
| Conservative | Jilian Saweczko | 8,559 | 24.3 | +3.9 | – | |||
| Green | Sonny Day | 975 | 2.8 | -2.3 | – | |||
| Total valid votes/Expense limit | 35,198 | 100.0 | ||||||
| Total rejected ballots | 288 | 0.8 | +0.1 | |||||
| Turnout | 35,486 | 53.10 | +2.4 | |||||
| Eligible voters | 66,807 | – | – | |||||
| New Democratic gain from Liberal | Swing | +12.95 | ||||||
| Canadian federal election, 2008 | ||||||||
|---|---|---|---|---|---|---|---|---|
| Party | Candidate | Votes | % | ∆% | Expenditures | |||
| Liberal | Alan Tonks | 16,071 | 46.6 | -10.5 | $48,748 | |||
| New Democratic | Mike Sullivan | 9,641 | 28.0 | +6.7 | $46,118 | |||
| Conservative | Aydin Cocelli | 7,021 | 20.4 | +3.0 | $27,300 | |||
| Green | Andre Papadimitriou | 1,757 | 5.1 | +1.3 | $2,977 | |||
| Total valid votes/Expense limit | 34,490 | 100.0 | $80,783 | |||||
| Total rejected ballots | 241 | 0.7 | ||||||
| Turnout | 34,731 | 50.7 | ||||||
| Liberal hold | Swing | -8.6 | ||||||